Observability and Incident Response
Detecting, Diagnosing, and Learning from Production Failures
Observability and Incident Response
Chapter 05 showed how to limit release risk with staged exposure and rollback. Those controls are effective only when the system produces evidence quickly enough to guide a decision. A container may be running, a health endpoint may return 200, and predictions may still be slow, inconsistent, or operationally harmful.
Monitoring evaluates known conditions. Observability makes it possible to investigate both expected and unexpected behaviour from the signals emitted by the system. Incident response turns those signals into coordinated action when service quality or decision safety is threatened.
This chapter continues the decision API case study. Version v1 is stable. Version v2 is released gradually, but its model-loading path increases latency and a configuration change alters its positive-decision rate. The exercise shows how service and model-system telemetry reveal different parts of the same incident.
Learning objectives
By the end of this chapter, you should be able to:
- distinguish health checks, monitoring, observability, and incident response;
- instrument a model service with useful metrics, structured logs, and traces;
- define service-level indicators, objectives, and error budgets;
- design actionable alerts and dashboards without excessive cardinality;
- investigate a release using version-correlated telemetry;
- coordinate detection, triage, mitigation, recovery, and communication; and
- write a learning-focused incident review with owned corrective actions.
From visibility to operational understanding
A health check answers a narrow question: can this process receive traffic? Monitoring asks whether selected measurements are within expected bounds. Observability supports the broader question: why is the system behaving this way?
OpenTelemetry describes observability as understanding a system’s internal state from its outputs; instrumentation produces telemetry such as metrics, logs, and traces (OpenTelemetry Authors 2026b). This distinction matters because an uninstrumented system cannot become observable merely by installing a dashboard.
| Capability | Question | Example |
|---|---|---|
| Liveness | Should the platform restart the process? | Is the event loop alive? |
| Readiness | Should this instance receive traffic? | Are the model and required dependencies loaded? |
| Monitoring | Is a known risk occurring? | Is p95 latency above its objective? |
| Observability | What explains the behaviour? | Which version and span account for the delay? |
| Incident response | What must happen now? | Roll back, communicate, and preserve evidence |
Do not make a readiness endpoint perform a full prediction or call every remote dependency. Expensive or fragile probes can create load and turn a dependency failure into a restart loop. Readiness should establish that the instance can serve; synthetic requests can test the complete user pathway separately.
Start with the user-facing promise
Telemetry is useful when it represents system responsibilities. Begin with the critical user journey:
valid request -> validated features -> model inference -> policy decision -> responseFor the case-study API, define two initial service-level indicators (SLIs):
- Availability SLI: proportion of eligible requests that complete successfully.
- Latency SLI: proportion of eligible requests completed within 300 milliseconds.
If good is the number of requests that meet the criterion and eligible is the number included in the measurement, then
\[ \text{SLI} = \frac{\text{good events}}{\text{eligible events}}. \]
A service-level objective (SLO) sets a target over a window. For example:
- at least 99.5% of eligible requests succeed over 28 days; and
- at least 99.0% complete within 300 ms over 28 days.
The availability error budget is the permitted fraction of unsuccessful requests:
\[ \text{error budget} = 1 - 0.995 = 0.005. \]
An SLO is not a claim that every request will succeed. It makes the acceptable reliability trade-off explicit and creates a shared basis for release policy. Google’s SRE guidance recommends alerting on threats to user-centred SLOs rather than on arbitrary internal thresholds (Beyer et al. 2026).
Define the measurement precisely
An SLI is incomplete until its numerator, denominator, scope, and source are specified.
| Decision | Case-study definition |
|---|---|
| Eligible requests | Authenticated POST /predict requests reaching the service |
| Successful request | Valid input returns the documented 2xx response within the timeout |
| Exclusions | Load tests, operator probes, and client-side 4xx validation failures |
| Latency boundary | Measured at the API gateway from request acceptance to final byte |
| Dimensions | Environment, route, status class, and release version |
| Evaluation window | Rolling 28 days; shorter burn-rate windows for alerts |
Exclusions must be narrow and auditable. Removing difficult traffic after an incident makes the SLI look better without making the service better.
The telemetry signals
Metrics, logs, and traces are complementary rather than competing tools. Context propagation can correlate them across service boundaries (OpenTelemetry Authors 2026a).
Metrics: detect and compare
Metrics aggregate repeated measurements efficiently. A minimal service set follows the four golden signals:
- traffic: request rate;
- errors: unsuccessful request rate;
- latency: a histogram of request duration; and
- saturation: CPU, memory, queue depth, connection-pool use, or concurrency.
The decision API also needs model-system telemetry:
- input validation and missing-feature rates;
- prediction score distribution;
- positive-decision rate;
- model, schema, and application versions;
- preprocessing and inference duration; and
- fallback, override, or manual-review counts.
These measures do not prove predictive quality. They reveal operational changes and immediate behavioural shifts. Chapter 08 will address data drift, model performance, and delayed labels in depth.
Use a histogram for latency when the system must compute quantiles across instances. A client-side summary generally cannot be aggregated correctly across replicas. Choose buckets around meaningful boundaries such as 100, 200, 300, 500, and 1,000 ms.
Avoid uncontrolled metric cardinality
Every unique label combination creates a time series. Safe labels usually have bounded values:
route=/predict
method=POST
status_class=2xx
environment=production
service_version=a81f4c2
model_version=credit-risk-2026-08-01
Never attach raw request_id, user_id, email address, free-form error text, or continuous prediction score as metric labels. These values create unbounded cardinality and may expose sensitive data. Put request identifiers in structured logs and traces; record scores in governed aggregates or restricted analytical stores.
Structured logs: preserve event context
Logs should be machine-readable events, not sentences that require regular expressions. A prediction completion event might contain:
{
  "timestamp": "2026-08-04T18:42:17.312Z",
  "severity": "INFO",
  "event": "prediction_completed",
  "request_id": "req-7f21",
  "trace_id": "4bf92f3577b34da6a3ce929d0e0e4736",
  "service_version": "a81f4c2",
  "model_version": "risk-2026-08-01",
  "schema_version": "3",
  "duration_ms": 184.7,
  "outcome": "success"
}
Log the operational facts needed for investigation, but do not log raw feature payloads, access tokens, health information, or other sensitive inputs by default. Establish retention, access, redaction, and deletion policies. A hash is not automatically anonymous if it can still be linked to a person.
Use consistent event names and severity levels:
DEBUG: detailed development evidence, normally sampled or disabled in production;INFO: successful lifecycle or business events;WARNING: degraded but handled conditions;ERROR: failed operation requiring investigation; andCRITICAL: system-wide or safety-significant failure.
Traces: explain request pathways
A trace represents an operation as related spans. For one prediction request, useful spans include:
POST /predict
├── validate_request
├── transform_features
├── model_predict
├── apply_decision_policy
└── write_audit_event
Each span records start time, duration, status, and bounded attributes. When p95 latency rises, traces can reveal whether time is spent in validation, transformation, inference, a database call, or audit-event delivery. OpenTelemetry defines traces through spans and their parent-child relationships (OpenTelemetry Authors 2026c).
Sampling controls trace volume. Head sampling decides at the start of the request and is simple, but may discard rare failures. Tail sampling decides after the trace completes and can retain errors or unusually slow traces, but requires more infrastructure. A practical policy keeps all errors, a high proportion of slow requests, and a smaller sample of ordinary successful requests.
Instrument the service boundary
Instrumentation should be implemented in shared middleware where possible so every request follows the same conventions.
from time import perf_counter
from uuid import uuid4

@app.middleware("http")
async def observe_request(request, call_next):
    request_id = request.headers.get("x-request-id", str(uuid4()))
    started = perf_counter()
    response = None
    try:
        response = await call_next(request)
        return response
    finally:
        duration = perf_counter() - started
        status = response.status_code if response else 500
        REQUESTS.labels(
            route=request.url.path,
            method=request.method,
            status_class=f"{status // 100}xx",
            service_version=SERVICE_VERSION,
        ).inc()
        LATENCY.labels(
            route=request.url.path,
            service_version=SERVICE_VERSION,
        ).observe(duration)
This is illustrative. Production middleware must normalize routes so identifiers do not become labels, handle cancelled requests correctly, propagate correlation IDs, and emit exceptions without duplicating them at every layer.
Version every signal
The following identifiers should be available in health metadata, logs, traces, audit records, and carefully bounded metric labels:
- Git commit or application version;
- container image digest;
- model artifact version and checksum;
- feature or schema version;
- decision-policy or threshold version; and
- deployment environment.
Version correlation turns “latency increased recently” into “latency increased for candidate v2 after traffic shifted at 14:20.” That is the difference between observation and actionable evidence.
Dashboards for decisions, not decoration
A dashboard should support a sequence of operational questions.
- Are users affected? Show availability, latency, traffic, and SLO budget.
- What changed? Add deployment annotations and split signals by release version.
- Where is the failure? Show saturation, dependency health, and trace exemplars.
- Is model-system behaviour changing? Show validation, score, decision, and fallback rates.
- Did mitigation work? Keep before-and-after periods visible.
The first page should fit on one screen and emphasize current user impact. Detailed resource, database, and model views can be linked as drill-down dashboards. Every alert should link to a relevant dashboard and runbook.
Alert on action, not curiosity
An alert is justified when a responder must take timely action. A good alert states:
- what user-facing condition is threatened;
- the affected service and environment;
- the observed value and threshold;
- when the condition began;
- likely recent changes;
- links to the dashboard and runbook; and
- the escalation route.
Burn rate
Burn rate measures how quickly the service is consuming its error budget. If the SLO permits an error fraction of \(0.005\) and the observed error fraction is \(0.02\), then
\[ \text{burn rate} = \frac{0.02}{0.005} = 4. \]
At a sustained burn rate of 4, the complete 28-day budget would be consumed in 7 days. Multi-window alerts combine a short window for rapid detection with a longer window that confirms persistence. This reduces pages from brief spikes while still detecting severe failures quickly.
Separate notification classes:
- page: urgent, user-affecting, and actionable now;
- ticket: important but safe to handle during working hours;
- dashboard: useful context that does not require a notification.
CPU at 85% is not automatically a page. Page when user-facing reliability is threatened and CPU evidence helps explain or predict that threat.
Practical exercise: observe a release incident
The supporting program creates deterministic, synthetic one-minute telemetry for a two-hour release window. It writes:
results/06-observability-telemetry.csv;results/figures/06-observability-dashboard.png; andresults/figures/06-incident-timeline.png.
Run it from the repository root:
bash scripts/bash/06-generate-observability-exercise.shor directly:
python scripts/python/06-generate-observability-exercise.pyThe scenario includes four operational phases:
| Time | System event | Expected evidence |
|---|---|---|
| 00–30 min | v1 baseline |
Stable p95 latency and decision rate |
| 30–60 min | v2 canary |
Version-local latency and decision-rate changes |
| 60–80 min | increased exposure | SLO burn accelerates and alert fires |
| 80–120 min | rollback and recovery | Traffic returns to v1; signals recover |
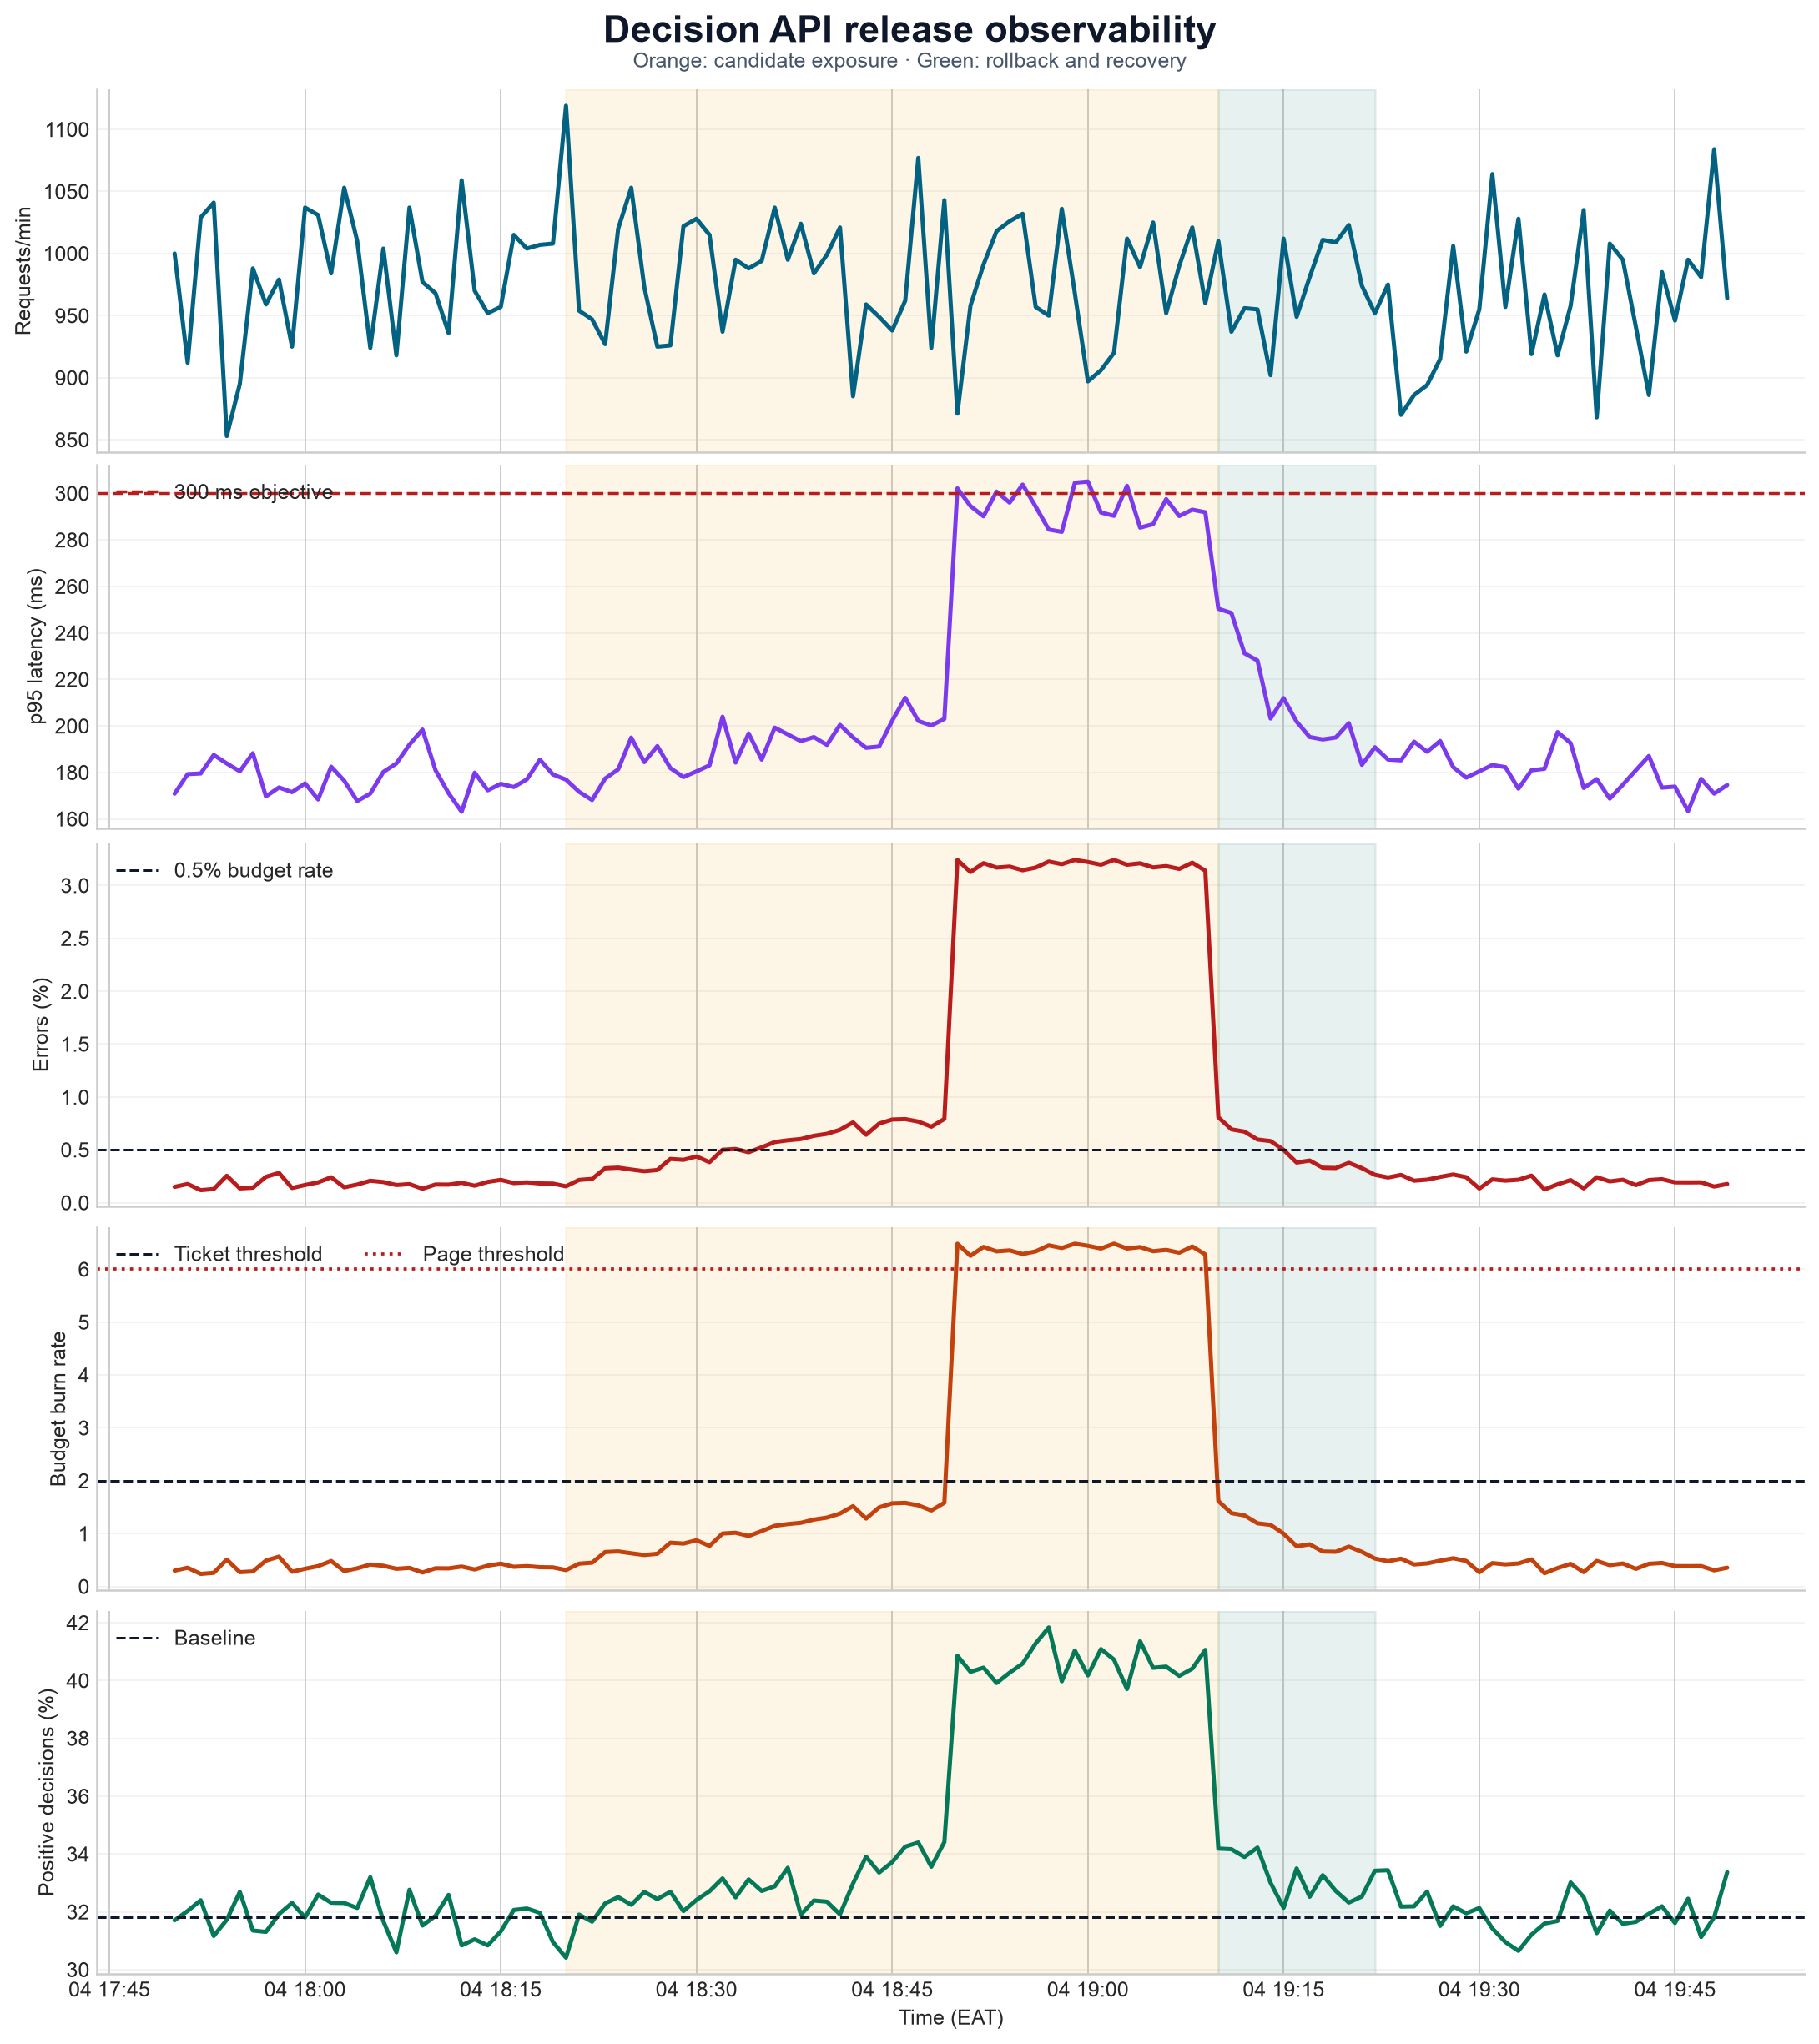
The panels should be read together. Traffic establishes exposure. Latency and errors show service harm. Burn rate translates errors into SLO urgency. Positive-decision rate reveals a behavioural change that ordinary uptime monitoring would miss.
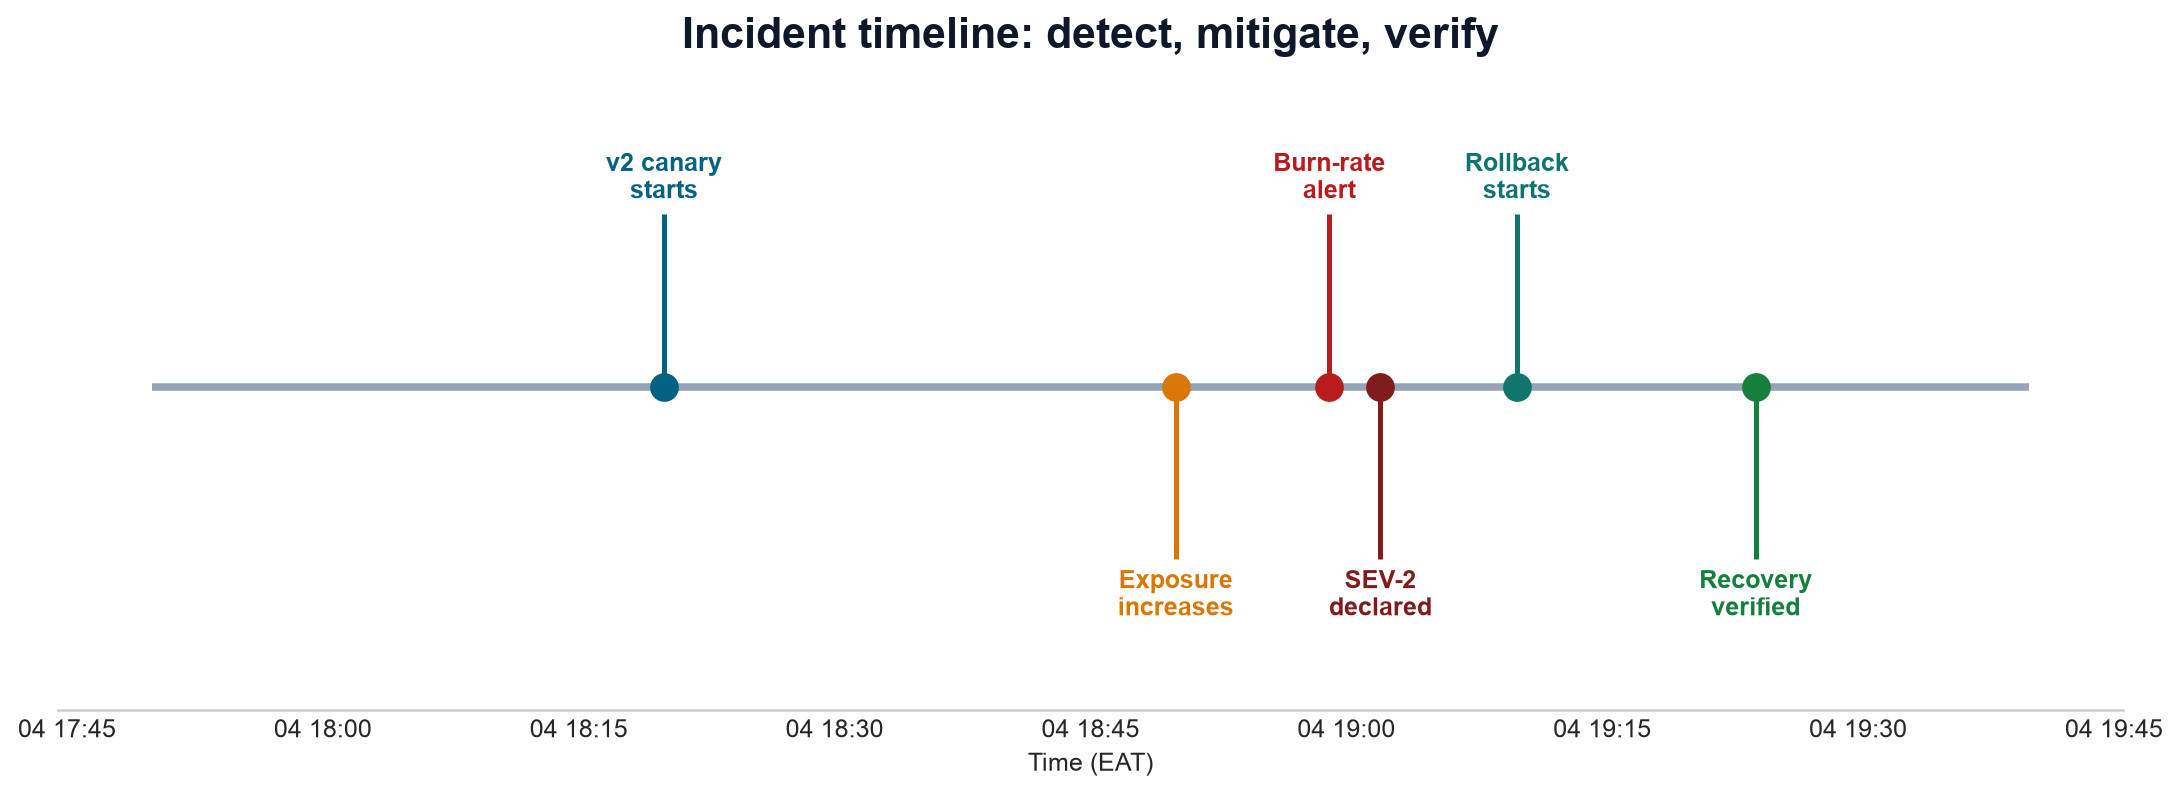
The exercise is a teaching simulation, not a production anomaly detector. Its thresholds are intentionally explicit so that operational reasoning is visible.
From alert to incident
An alert is evidence. An incident is a coordinated response to actual or credible harm. Declare an incident early when the response requires urgency, multiple people, user communication, or explicit coordination. The declaration creates shared structure; it is not an admission of individual failure.
Severity model
Severity should reflect impact and urgency, not the seniority of the person reporting it.
| Severity | Example impact | Response expectation |
|---|---|---|
| SEV-1 | Widespread outage, unsafe decisions, or major data exposure | Immediate response, executive and stakeholder communication |
| SEV-2 | Material degradation or incorrect behaviour affecting a meaningful subset | Immediate on-call response and coordinated mitigation |
| SEV-3 | Limited impact with a safe workaround | Prompt working-hours response unless conditions worsen |
| SEV-4 | No current user impact; reliability weakness or near miss | Track and correct through normal planning |
The case-study event is initially SEV-2: production decisions and latency are affected, but exposure is limited by the canary and rollback is available. Escalate if impact expands or decision safety cannot be established.
Incident-response lifecycle
flowchart TD
    A["Detect and validate"] --> B["Declare and assign roles"]
    B --> C["Assess impact"]
    C --> D["Mitigate and contain"]
    D --> E["Verify recovery"]
    E --> F["Review and improve"]
    D --> C
1. Detect and validate
Confirm that the alert is real, identify the affected user journey, and check recent deployments and configuration changes. Do not spend the first critical minutes proving a complete root cause.
2. Declare and assign roles
For a substantial incident, establish:
- incident commander: owns priorities and coordination;
- operations lead: investigates and performs mitigation;
- communications lead: sends accurate, time-stamped updates; and
- scribe: records observations, decisions, commands, and timestamps.
In a small team, one person may cover multiple roles, but the responsibilities should remain explicit.
3. Assess impact
State what is known and unknown:
- start time and detection time;
- affected routes, versions, users, regions, or decision slices;
- current traffic exposure;
- service and decision consequences;
- data integrity or privacy implications; and
- whether a safe fallback exists.
For model systems, impact is not limited to failed requests. Determine whether successful responses may contain incorrect or policy-inconsistent decisions and whether downstream actions are reversible.
4. Mitigate before optimizing diagnosis
The first goal is to reduce harm. Appropriate mitigations include:
- stop the rollout and return traffic to the known-good version;
- disable the affected pathway with a feature flag;
- move uncertain cases to manual review;
- shed non-critical load;
- isolate a failing dependency; or
- temporarily fail closed when continuing would be unsafe.
Rollback application code only when the model, schema, policy, and data dependencies remain compatible. If the release performed an irreversible schema or data migration, restoration may require a forward fix or a documented fallback.
5. Verify recovery
The absence of an alert is not enough. Confirm that:
- user-facing SLIs returned to acceptable levels;
- queues and saturation are draining rather than merely hidden;
- behavioural signals returned to the expected range;
- the known-good version is serving all intended traffic;
- delayed jobs and downstream systems recovered; and
- no unsafe decisions require correction or notification.
Observe for a defined stability window before closing the incident.
6. Communicate on a predictable cadence
An incident update can be short:
18:52 EAT — SEV-2 — Decision API degradation
Impact: elevated latency and altered decision rate on v2 canary traffic.
Action: rollout stopped; traffic returning to v1.
Current state: error rate falling; decision audit in progress.
Next update: 19:07 EAT or sooner if severity changes.
Communicate confirmed facts, label hypotheses, record decisions, and publish the next update time. Avoid exposing sensitive operational details in public status messages.
A disciplined investigation
Use correlation rather than random dashboard searching.
- Start with the alerting SLI and confirm user impact.
- Compare affected and unaffected dimensions:
v2versusv1, route, region, or instance. - Align the change timeline with the first deviation.
- Inspect saturation and dependency signals.
- Move from a metric exemplar to representative traces;
- use trace and request IDs to retrieve structured logs; and
- form a falsifiable hypothesis and test one safe change at a time.
For this scenario, the evidence supports two hypotheses:
- latency is release-specific because
model_predictspans are longer only forv2; and - the decision-rate shift is policy-specific because inputs remain stable while the threshold version changed.
Both can be true. Stopping after the first technical explanation would restore latency while leaving decision behaviour incorrect.
Runbooks make alerts actionable
Every paging alert should link to a short, tested runbook. Include:
# Decision API high error-budget burn

## Meaning
User-facing availability is consuming the 99.5% SLO budget rapidly.

## First checks
1. Confirm `/predict` impact and affected versions.
2. Check deployment and configuration events.
3. Compare v1 and v2 latency, errors, and decision rate.

## Safe mitigations
- Pause traffic progression.
- Route traffic to the last known-good release.
- Enable manual-review fallback if decision safety is uncertain.

## Escalation
Page the service owner; involve model-risk owner for behavioural changes.

## Recovery checks
Verify SLIs, decision rate, queue drainage, and audit completeness.
Runbooks should name prerequisites and dangerous actions. Test them during game days because an untested rollback command is only a hypothesis.
Incident review: learn without simplifying the system
After recovery, preserve the timeline and conduct a learning-focused review. Avoid treating “human error” as a root cause. Ask why the action was reasonable in its context and which controls allowed it to cause harm.
A useful review contains:
- concise summary and severity;
- user, decision, data, and business impact;
- detection and response timeline;
- contributing technical and organisational conditions;
- what worked and what increased impact;
- where detection or recovery relied on luck; and
- corrective actions with owners, priority, and due dates.
Measure response quality
Useful intervals include:
- time to detect: impact start to detection;
- time to acknowledge: alert to responder acknowledgement;
- time to mitigate: detection to material harm reduction; and
- time to recover: impact start to verified restoration.
These values improve process design; they should not become simplistic individual performance scores.
Convert findings into controls
Weak action: “Be more careful when changing thresholds.”
Stronger actions:
| Finding | Corrective action | Verification |
|---|---|---|
| Policy version changed without visibility | Emit policy version in health, logs, traces, and audit records | Integration test asserts the value |
| Canary gate checked only HTTP errors | Add decision-rate divergence gate by version | Deployment simulation fails unsafe candidate |
| Slow model path was not traceable | Add preprocessing and inference spans | Trace test confirms spans and attributes |
| Rollback required undocumented commands | Automate and game-test rollback | Quarterly exercise meets recovery objective |
| Alert lacked ownership | Add service catalogue owner and escalation route | Paging test reaches current on-call owner |
Corrective actions need closure evidence. A ticket marked complete without a test, dashboard, exercise, or policy check may not reduce recurrence risk.
Operational anti-patterns
Collect everything
Unbounded telemetry raises cost, hides important signals, and increases privacy risk. Define a purpose, retention period, access policy, and sampling strategy for each signal.
Alert on every threshold
This creates fatigue and teaches responders to ignore pages. Alerts should map to user impact or imminent SLO risk and have a documented action.
Use one dashboard for every audience
Executives, incident commanders, service engineers, and model owners need different levels of detail. Share the same underlying evidence but design views around decisions.
Treat HTTP 200 as correctness
Successful transport does not prove correct preprocessing, model identity, threshold behaviour, or downstream action. Pair service SLIs with bounded behavioural checks.
Diagnose fully before mitigating
Root-cause certainty can take hours. A reversible rollback or traffic stop can reduce harm in minutes while preserving evidence for later analysis.
Close when the graph looks normal
Confirm recovery across user, queue, data, model-system, and downstream signals. Record follow-up work before dissolving the response structure.
Minimum production checklist
Before the decision API receives production traffic, confirm that:
- liveness and readiness have distinct semantics;
- metrics cover traffic, errors, latency, saturation, and bounded model behaviour;
- logs are structured, correlated, redacted, and governed;
- traces identify expensive or failing spans;
- application, image, model, schema, and policy versions are visible;
- SLIs, SLOs, exclusions, and error-budget policy are documented;
- paging alerts are actionable and link to owned runbooks;
- dashboards show deployment events and compare release versions;
- rollback and safe fallback pathways are tested;
- incident roles, severity, escalation, and communication expectations exist; and
- incident actions have owners and verification criteria.
Chapter summary
Observability is part of the model system, not a tool added after deployment. Metrics detect and compare, logs preserve event context, and traces explain request pathways. Shared identifiers and release metadata connect those signals into evidence.
SLOs translate user expectations into measurable reliability objectives, while error budgets and burn-rate alerts connect evidence to action. During an incident, the priority is to establish impact, coordinate clearly, reduce harm, verify recovery, and preserve a reliable timeline. The review then converts failure into durable controls.
The next chapter uses this operational evidence to reason about scaling, reliability, and cost. A system should not scale merely because traffic rises; it should scale in ways that protect its user-facing objectives and decision responsibilities.